What is Data Literacy?
What happens after students are assessed or assignments have been completed? What do you do with all the data collected? How do you as a teacher interpret that data? Data Literacy is learning how to use the information that was collected and analyze it in order to power quality instruction for students. It is important to "empower teachers with data and the skills to use them to improve instruction increases their ability to meet policy and personal goals of ensuring that students are engaged in learning and on track for college and careers. Without necessary data use skills, teachers do not have a powerful tool to make the best decisions to improve student achievement." (DQC, 2014) As teachers we compile a lot of student data and it is important that we understand what to do with that information or else what would be the point of collecting it?
DQC. (February 2014). Teacher data literacy: It's about time. Retrieved from http://dataqualitycampaign.org/wp-content/uploads/2016/03/DQC-Data-Literacy-Brief.pdf
DQC. (February 2014). Teacher data literacy: It's about time. Retrieved from http://dataqualitycampaign.org/wp-content/uploads/2016/03/DQC-Data-Literacy-Brief.pdf
Revisiting assessment tools and how each tool organizes and analyzes data.
I-ReadyFor Teacher
There are several ways that i-Ready complies student data that are helpful for teacher use. Here are a few of the ones that I use all of which can be found under the very convenient tab labeled Reports: Whole Class - Instructional Grouping Profile which gives you a sense of how to group your students once the diagnostic test has been administered. This report if helpful to glance at while grouping, but I use it as a reference along with other data collected to ensure that students are grouped properly. After all they may have a bad test day and these groupings are based on one test.
-Student Growth which will show at a glance how students did on the diagnostic test and their progress towards standards. I give the test in the beginning, middle, and end of the school year to keep track of student progression and I can view all three test here for every student.
-Class Response to Instrution which collects data on how well students are doing on growth lesson (lesson given by i-Ready at there level) and on extra lessons (lessons given by the teacher that may correlate to lessons covered in class). -Student Performance is also a handy one to use because it keeps track of students performance from the previous year so that you can seen the difference in grade levels.
Individual Students
-CA CCSS Performance (California Common Core State Standards) gives a report on which standards have been mastered, are in progress, or have not been mastered. This is awesome especially at report card time when you are trying to explain the standards to parents. You can set it for just your grade level or do what I like to do and set it across grade level to show which one in previous grades they have still yet to master and why we are still working on that skill set in their current grade. -Batch Student Profile Overview shows what level students are at in each overall standard category. The word Batch means instead of printing out a student at a time it will print out the whole class, but broken up as individual page breaks. Again this is convenient for parent conferences or to print out for the students to show where they are at. For Students
What students can view: Students can see what their percentage is after they have completed an assignment. Student can also view their progress under the Progress tab and they can see the percentage of assignments in the order of what they have completed and there is a graph that shows their progression over time. |
KahootFor Students
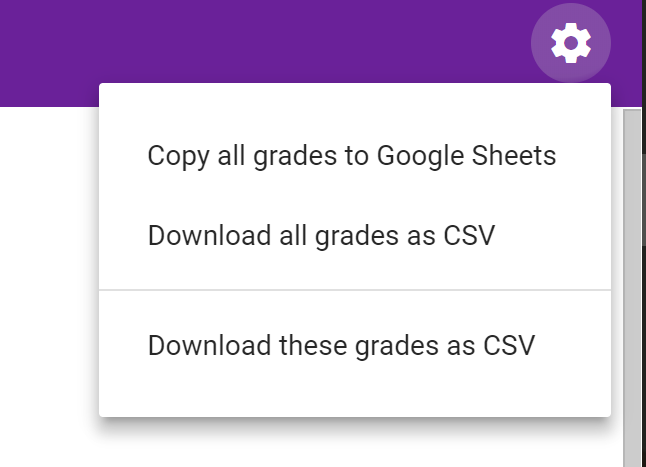
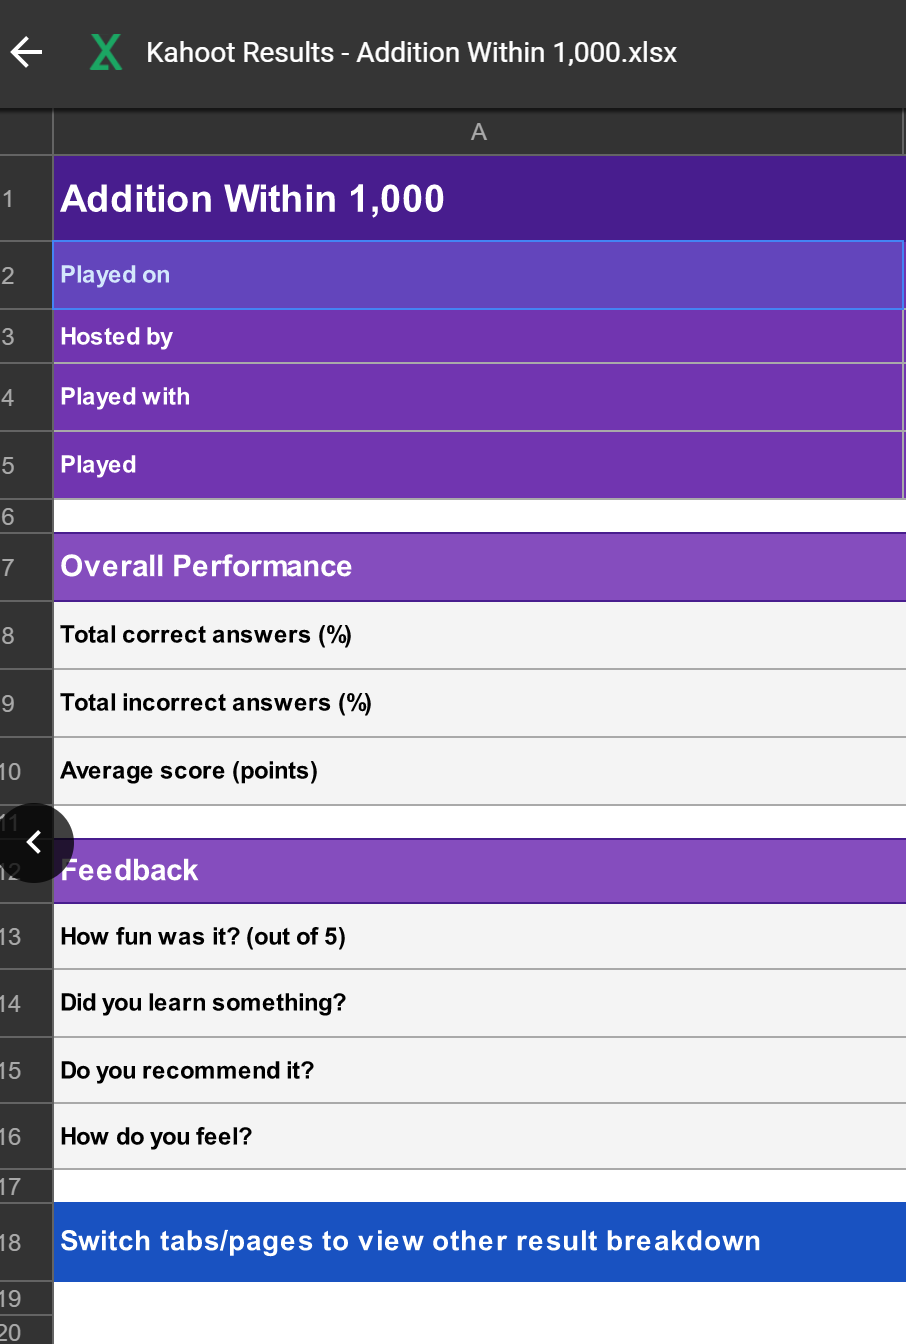
They get instant feedback on how well they are doing and so are they are becoming aware of their strengths and ares in need of improvement are. For Teachers When students are done playing/ taking the quiz the data is collected and the teacher can then "view all of your results" which is a button found under the teacher site where you can also create new quizzes. From there you can download the results onto the computer or you can send it to your Google Drive account. If you send it to the Drive it will show you the data in Google Sheets and breaks it down into percentages for the whole class. Here is an example of what you might see:

|
Google ClassroomFor Teachers
It is a great tool to organize online assignments for students. Teachers can create topics and then under those designation they can add assignments, post questions, or create announcements to students. 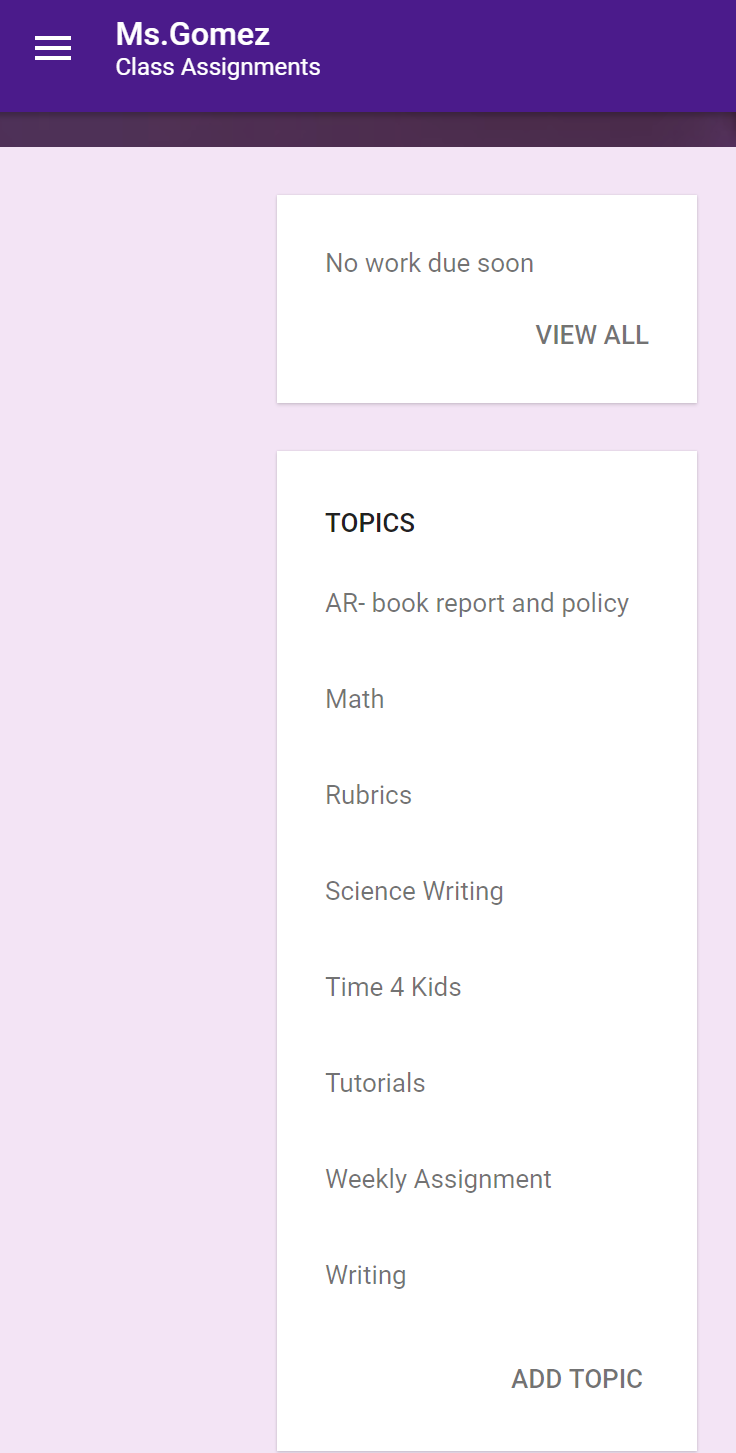
Not only is it a great tool to organize and collect data on students, but it also can function as a way to help analyze the data collected. Teachers can add grades to assignments and then they can transfer the data into a format that they could use for their grade-book.
For Students Google Classroom is effective at keeping assignments organized for students. Students can find assignments quickly by looking at it by topics. Once the assignment is found the students can see when the due date is or if the assignment is late. Students are able to submit and unsubmit assignments when needed. The unsubmit function is extremely helpful to students because after looking at comments they have the opportunity to go back and fix work. Students are able to see what grade they got on tasks as well. This tech tool falls under the category of LMS. What is LMS?Learning Management Systems are online platforms that "help the instructor deliver material to the students, administer tests and other assignments, track student progress, and manage record-keeping." (Wikipedia, 2017)
Learning management system. (2017, November 16). In Wikipedia, The Free Encyclopedia. Retrieved 05:24, December 6, 2017, from https://en.wikipedia.org/w/index.php?title=Learning_management_system&oldid=810647766 |
New Resources incorporating Data Literacy
Moodle
|
Quizlet
|
Schoology
|

Moodle is a very customizable LMS program. The reason why I underlined very is because for me at least it isn't as intuitive as I would like and I was a little to overwhelmed by how much I could do with that site.
What I like about it is that they allow you to do a demo as an admin, teacher, student, or parent under a school setting so that you can get a sense of what it would be like to use the program from all points of view. It also allows you to do a demo called sandbox where it is a basic blank slate to work with. As far as student tracking and analyzing data is concerned with Moodle it is integrated with the program, which is like with most LMS. Under the access of the teacher would you find the grade tab. There teachers can customize how to set up grade scale weights and view the grader report, grade history, outcomes and overview report (again tons of options to customize the experience for the teacher).
|
I have discovered and fell in love with this site!
I have always been a big fan of flash cards and now it has been translated into a digital way. You can create flash cards for students to use when trying to learn concepts, but with quizlet you don't have to stop there. It is possible to take those terms and also create: -flashcards -write (writing terms of the displayed definitions) -spell (which is your basic spelling test where you type what you hear) -test (which has the ability to have true/false, multiple choice, matching, and fill in the blank test) and games such as: -match (which you have to put together the term and definition while trying to beat the clock and other peoples scores) -gravity (which is where you have to type your answer before the asteroid falls to the ground). This site is great for formative assessment use because of the ongoing practice and quizzes that students are receiving. Under the teacher site student progress is being tracked as well. The teacher can see which activity the students have completed, when they did it, and their best scores. |
This is a LMS program which I am excited about trying out. For me it's like Moodle and Google Classroom had a baby and this is what you came out with. It's the best of both. The ease of Google Classroom with the depth of Moodle. If you have ever taken a online course this would look very familiar to you or if you Here as the instructor you can create courses and post events/assignments. What I like about this is it has a calendar view of when things are upcoming and due, which Google Classroom does not. I find that having the visual of what assignments are upcoming is important to students and with Google Classroom it will indicate past due or have the due date on the assignment itself but so far from the student screen it does not display it in a calendar mode.
Schoology can also be an assessment tool because it also allows you to create quizzes and test with in the platform with numerous options to configure how you want students to take the assessments. With the creation of assignments and assessments it also keeps track of student performance data, while still allowing the teacher the flexibility of changing grades of students. Below are two videos that helped me understand how to interact with the program.
Part two video
|
